Which Test Do I Use?


A graphical guide for choosing which statistical test best fits your objectives. From our Applied Environmental Statistics course.

Online at:

Some definitions:
Statistical tests can be classified into 5 types, based on the measurement scales of your response and explanatory variables.
Are those scales continuous, or grouped?

Response variable
the variable you are trying to understand
usually plotted on the Y axis
can be continuous (1.4, 2.5, ...) or grouped (above detection limit, below detection limit)

Explanatory variable
variable used to explain Y
usually plotted on the X axis
can be continuous (1.4, 2.5, ...) or grouped (ag, urban, forest)

Think about how you might plot the results of your data analysis. Choose (click on) a procedure based on whether your response and explanatory variables are continuous or grouped:

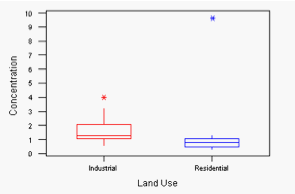
.Compare data among two or more groups
Continuous Y Grouped X
Compare differences among two or more groups


Continuous Y Continuous X
Relate a continuous Y variable to one or more continuous explanatory variables


Continuous Y both Grouped and Continuous X
Is there 1 or more than 1 regression line?


Grouped Y Grouped X
Do percentages of Y categories (detect / nondetect) change between two or more groups (June vs. Sept)?


Grouped Y Continuous X
Do percentages (% hits) change as one or more explanatory variables (thickness) change?